How to Track Claude Code 5-Hour Window Usage

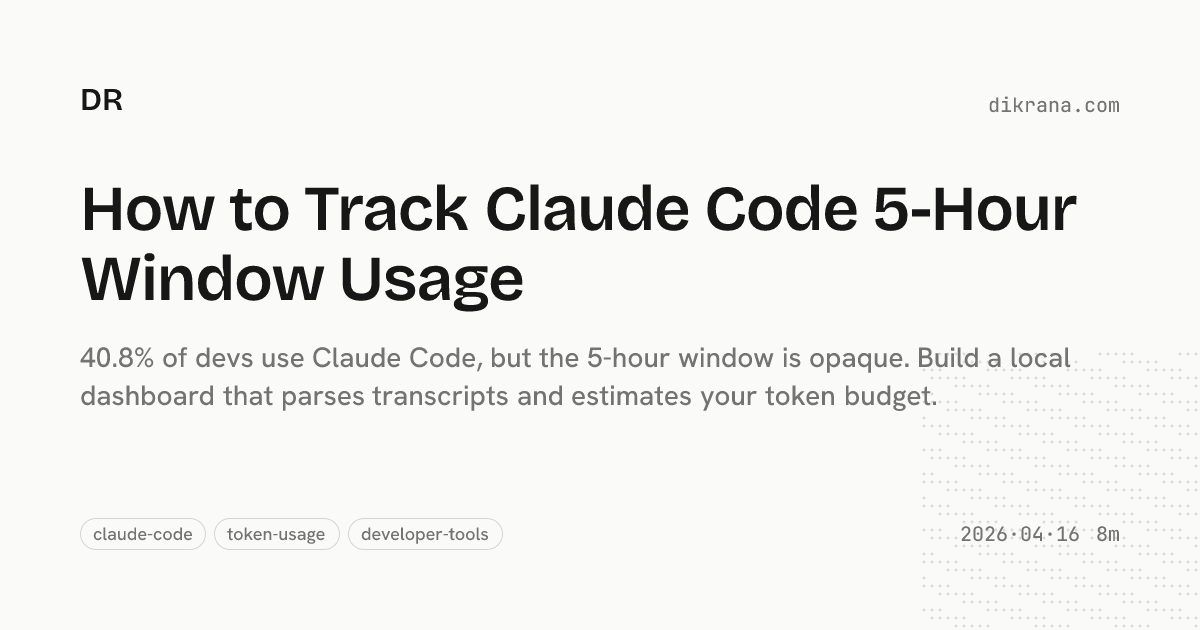
If you’re on a Claude Max plan, you’ve seen the percentage bar. “47% used.” But 47% of what, exactly? How many tokens is that? What’s it costing you in API-equivalent dollars? And how much runway do you actually have before the window resets?
Anthropic doesn’t expose token-level detail for the 5-hour window. You get a percentage and a reset time. That’s it. With 40.8% of developers now using Claude Code (Stack Overflow 2025 Developer Survey, 2025), and Max plans running $100-200/month (Anthropic, 2025), there’s a real gap between what you’re paying and what you can see.
So we built a local tracker that fills that gap. It parses your Claude Code transcripts, applies real model pricing, and reverse-engineers your 5-hour window budget from two data points Anthropic does give you.
Key Takeaways
- Claude Code logs every interaction as JSONL at
~/.claude/projects/; each entry contains model name, token counts, and cache metrics- Combining observed token costs with the
/usagepercentage lets you extrapolate total window capacity (e.g., 47% used + $2.15 observed = ~$4.57 full window)- The open-source tracker persists everything in SQLite with a terminal dashboard that refreshes every 10 seconds
- For team rollup, the same events ship to Grafana Loki as labelled JSON, with a starter dashboard for cost-by-user, cost-by-model, and cache hygiene
- You can install it today or fork the approach for your own tooling
Why Does the 5-Hour Window Need a Tracker?
Claude Max subscribers pay $100/month (5x Pro) or $200/month (20x Pro) for higher rate limits across a sliding 5-hour window (Anthropic, 2025). Enterprise usage averages roughly $13 per developer per active day (Anthropic Docs, 2026). That’s meaningful spend, but the feedback loop is thin.
Here’s what you can’t see natively:
- Token counts per window. The percentage bar doesn’t map to a number you can reason about.
- Dollar-equivalent cost. A session heavy on Opus 4.6 ($5/$25 per MTok input/output) burns budget faster than one on Sonnet ($3/$15) (Anthropic Pricing, 2026). The bar treats them the same.
- Burn rate. Are you on pace to hit the limit in 2 hours or coast through all 5?
What you can access locally: Claude Code writes every assistant response to JSONL transcript files, complete with token breakdowns. And the /usage command returns that percentage plus a reset timestamp. Those two pieces are enough to reconstruct the full picture.
The core insight: if you know what percentage of the window you’ve used and you know the exact tokens and cost of the work you did during that percentage, simple division gives you the full window estimate.
How Does the Tracker Work?
The architecture is three inputs feeding one output:
JSONL transcripts  ──→  Parser  ──→  Usage Events  ──→  SQLite
                                                          ↓
LiteLLM pricing    ──→  Cost calc ────────────────────────┘
                                                          ↓
/usage snapshots   ──→  Window %  ──→  5-hour estimate  ──→  Dashboard
Transcript parsing. Claude Code stores session logs at ~/.claude/projects/**/*.jsonl. Each assistant entry contains the model name, input/output token counts, cache read/write tokens, and speed tier. The parser validates entries with a Zod schema and deduplicates by message ID. The same JSONL is also the input to agent backtesting, where the recorded turns are normalized and replayed under new configurations to catch behavior regressions before they ship.
const assistantEntrySchema = z.object({
  type: z.literal("assistant"),
  timestamp: z.string().optional(),
  message: z.object({
    id: z.string().optional(),
    model: z.string(),
    usage: z.object({
      input_tokens: z.number().optional(),
      output_tokens: z.number().optional(),
      cache_creation_input_tokens: z.number().optional(),
      cache_read_input_tokens: z.number().optional(),
      speed: z.enum(["standard", "fast"]).optional(),
    }),
  }),
});
Pricing. Model costs come from LiteLLM’s public pricing dataset, cached locally for 24 hours, with hardcoded fallbacks for Claude models. Each event gets a cost estimate: (input × input_rate) + (output × output_rate) + (cache_write × write_rate) + (cache_read × read_rate).
Snapshot capture. An expect script spawns the Claude CLI, sends /usage, and parses the terminal output. It strips ANSI codes, extracts percentage values, and fuzzy-parses reset times like “Mon 14 at 2:30pm” into ISO timestamps. Results persist to ~/.local/share/claude-cost/claude-usage.json so the dashboard can boot instantly from cache.
How Does the 5-Hour Estimation Work?
This is the part that makes the tracker useful beyond simple cost logging.
The estimation function takes two inputs: the latest /usage sample (a percentage and reset time) and all Claude Code events observed within that window. The math is straightforward:
// Filter events to the current 5-hour window
const windowStartAt = subtractHours(latestSample.resetAt, 5);
const observedEvents = events.filter(
(e) => e.source === "claude-code"
&& e.timestamp >= windowStartAt
&& e.timestamp <= latestSample.fetchedAt,
);
// Sum what we've observed
const observedTokens = observedEvents.reduce((sum, e) => sum + e.totalTokens, 0);
const observedCostUsd = observedEvents.reduce((sum, e) => sum + e.estimatedCostUsd, 0);
// Extrapolate to full window
const estimatedFullWindowTokens = Math.round(
(observedTokens / latestSample.percentUsed) * 100
);
const estimatedFullWindowCostUsd =
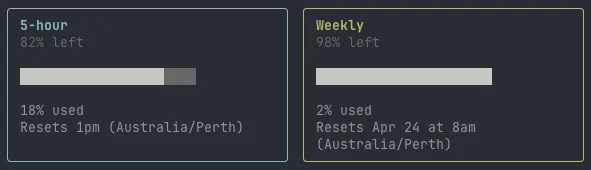
(observedCostUsd / latestSample.percentUsed) * 100;Example. You’ve used 47% of your window. The tracker observed 98,000 tokens costing $2.15 during that period. Full window estimate: ~208,500 tokens at ~$4.57. Remaining budget: ~110,500 tokens, roughly $2.42. You know exactly how much room you have.
The dashboard also keeps a rolling history of the last 6 windows, grouped by reset time. That lets you spot patterns: maybe your morning sessions burn through 80% of the budget while afternoon ones barely touch 30%.
There’s another reason this history matters. Anthropic adjusts window capacity dynamically based on overall platform demand. Your 5-hour budget at 2am on a Tuesday isn’t the same as your budget at 10am on a Monday. These adjustments happen silently with no notification, no changelog, no banner in the CLI. The percentage bar moves at different rates on different days, and without historical data you’d never notice. By tracking estimates across windows, you can see the variance firsthand: a “full” window might be worth $5.20 one session and $3.80 the next.
What Does the Dashboard Show?
The terminal UI runs on React Ink with four tabs:
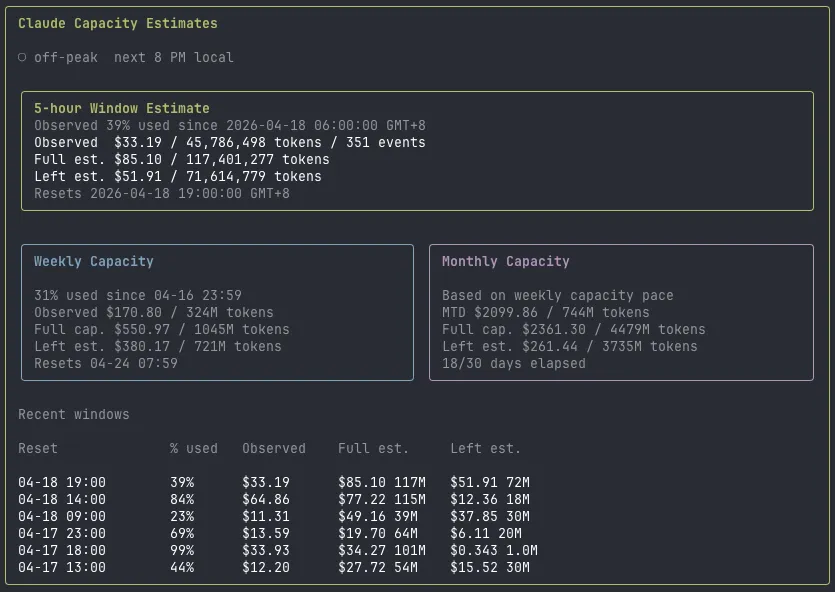
- Overview. Today/week/month cost, token breakdown by type (input, output, cache read, cache write), per-source split across Claude Code, Codex CLI, and Cursor. The 5-hour estimate card sits here with window start, percentage used, observed vs. projected cost, and reset countdown.
- Projects. Top projects by cost, today and this month.
- Models. Daily breakdown per model with input/output split.
- Daily. Seven-day cost trend with bar visualization.
It auto-refreshes every 10 seconds. The /usage snapshot refreshes every 5 minutes to avoid hammering the CLI. You can filter by source with --source claude-code if you only care about one tool.
How Do You Install and Extend It?
The tracker is open source at github.com/iceinvein/token-usage-cost. It runs on Bun.
# Clone and install
git clone https://github.com/iceinvein/token-usage-cost.git
cd token-usage-cost
bun install

# Sync transcripts and launch the dashboard
bun run src/cli.ts sync
bun run src/cli.ts dashboard
The sync command parses all local transcripts, fetches pricing, and writes events to SQLite. The dashboard command launches the interactive terminal UI.
Some ideas if you want to extend it: add Slack or webhook alerts when you cross 80% of a window. Wire it into a cron job so sync runs automatically. Build a web dashboard instead of a terminal one. The data is all in SQLite, so it’s straightforward to query however you want.
How Do You Roll It Up Across a Team?
Solo tracking gives you self-awareness. Team tracking gives you budgeting. At roughly $13 per developer per active day, a ten-person engineering team is moving low-thousands a month with no native rollup. The Anthropic billing API covers direct API usage, but Max plan seats don’t show up there, and that’s where most Claude Code spend lives in practice.
claude-cost ships every parsed event to Grafana Loki as a labelled JSON log line. Each developer pushes from their own laptop on a schedule (cron, launchd, or a manual bun run loki:push). Loki indexes the labels (team, env, tool, user); Grafana queries it back out with LogQL.
Dev laptop ──► claude-cost sync ──► SQLite ──► loki:push ──► Grafana Loki
                                                                    │
                                              Grafana dashboard ◄───┘
Setup is a .env.local and a reachability check:
LOKI_URL=https://logs-prod-XXX.grafana.net
LOKI_USERNAME=your-loki-user
LOKI_PASSWORD=your-loki-token        # or LOKI_TOKEN
LOKI_TEAM=platform
LOKI_ENV=prod
LOKI_MAX_AGE_HOURS=168               # only ship events from the last 7 days

bun run loki:test    # verify auth and reachability
bun run loki:push    # batched, retried push of unsynced events
Pushes are idempotent. Each event has a synced_at flag in SQLite, so re-running loki:push only sends what’s new. Events older than LOKI_MAX_AGE_HOURS are flagged synced rather than uploaded, which keeps backfills bounded if a teammate clones the repo and tries to ship six months of history at once.
A starter Grafana dashboard ships at grafana/claude-cost-overview.json. Drop it into a Grafana Cloud workspace and the team view falls out of one LogQL query template:
- Total cost, events, distinct users, and distinct models for the selected range
- Daily cost stacked by tool (Claude Code vs Codex vs Cursor)
- Daily token mix (input, output, cache read, cache write)
- Top 20 users by cost
- Cost by model with per-user drilldown
- Cache read share of total tokens (the cache hygiene metric)
- Output / input token ratio per model
Every panel rides the same query shape:
sum_over_time(
  {service="claude-cost", team="$team", env="$env", tool=~"$tool"}
  | json | unwrap cost_usd [$range]
)
Templated team, env, and tool variables let you slice between teams, environments, and tools at query time without rewriting panels.
What ships. Token counts, cost estimates, model names, session IDs, message IDs, and a user label. Prompts and model output never leave the machine. Set LOKI_USER_LABEL to a pseudonym if you would rather not put OS usernames in Grafana.
Cleanup. bun run loki:delete files a Loki delete request against a matching label set if you push a bad batch; bun run loki:reset clears local synced_at flags so the next push reships.
If you already run an OpenTelemetry stack, Claude Code’s native OTel export is a cleaner fit since it pushes metrics directly without going through transcripts. The Loki path wins when you want per-event JSON for ad-hoc LogQL slicing instead of pre-aggregated metrics, or when you want a single rollup that also covers Codex CLI and Cursor activity from the same machines.
The 5-hour window doesn’t have to be a black box. Two data sources, some arithmetic, and a bit of terminal UI get you from “47% used” to “you’ve got about 110K tokens and $2.42 left before 3pm.” Spending tokens well is upstream of tracking them; for the per-surface allocation framework that keeps the always-loaded budget tight, see Context Engineering in Practice.
Frequently Asked Questions
Does the tracker work with Claude Pro or just Max?
The token parsing and cost estimation work on any Claude Code plan since all plans write the same JSONL transcripts. The 5-hour window estimate specifically needs a /usage sample, which requires an active subscription with rate-limited windows.
How accurate is the 5-hour window estimate?
It depends on how recently you fetched /usage. The estimate is most accurate right after a sync, since the percentage and observed tokens are in close alignment. The dashboard auto-refreshes snapshots every 5 minutes to keep drift minimal.
Can I track Cursor or Codex CLI usage too?
Yes. The tracker ingests Codex sessions from ~/.codex/state_5.sqlite and Cursor workspace activity from its VS Code state databases. Codex gets aggregate token estimates since it doesn’t expose per-message breakdowns. Cursor currently tracks activity timestamps but not token counts.
What gets sent to Loki when I enable team aggregation?
Per-event JSON: model name, speed tier, input/output/cache token counts, estimated cost, session ID, message ID, timestamp, and a configurable user label. No prompt content and no model output ever leaves the machine. The label set is service, team, env, tool, which keeps Loki cardinality low while still allowing per-user queries via the user field inside the JSON payload.
If it was useful, pass it along.