Your Harness Is the Cost Line, Not Your Model
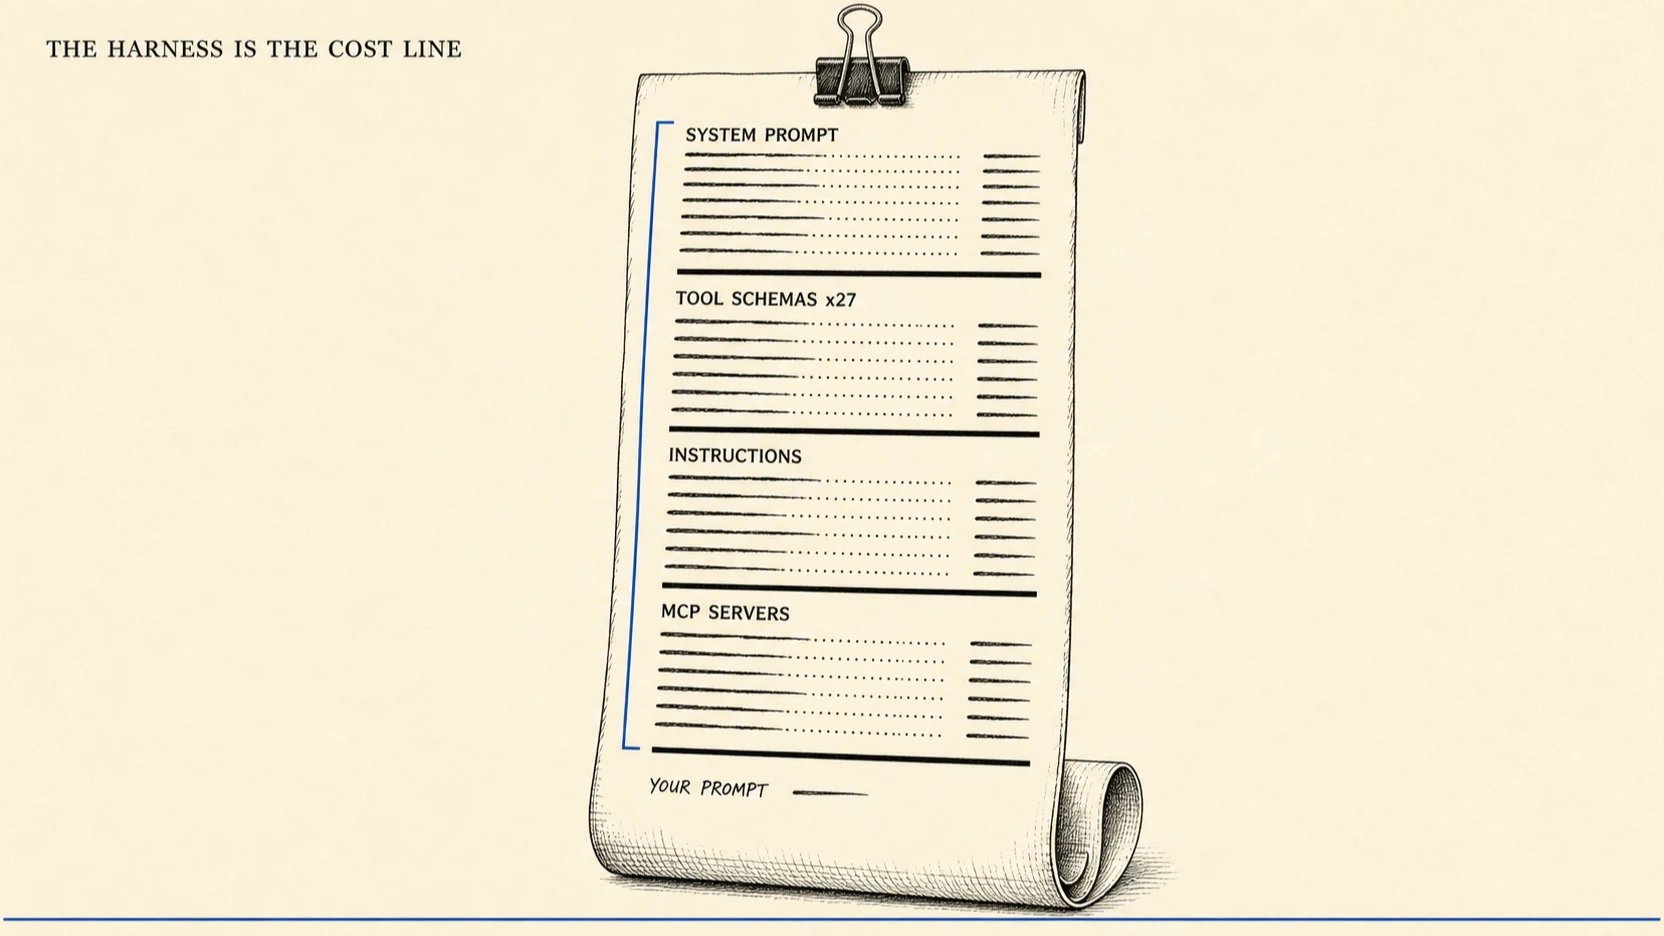
On 2026-07-12, someone put a logging proxy between Claude Code and the API and counted what crosses the wire before the user’s prompt. The answer was about 32,800 tokens. OpenCode, doing the same job, sent about 6,900 (Systima, 2026-07-12). The thread that followed was the highest-traction cost complaint of the month.
I’ve written four posts on agent cost. All four optimise inside a harness I took as given: route the turn down a tier, engineer the cache prefix, compress the output. Every one of those is real. Every one is second-order, because the harness sets the floor before any of them apply. This post measures the harness.
What follows is four independent measurements from an eight-week window, what each one actually establishes, the two figures that don’t survive scrutiny, and a ranked list of levers with per-token price at the bottom.
Key Takeaways
- The pre-prompt floor is about 32,800 tokens on Claude Code against about 6,900 on OpenCode, and roughly 24,000 of Claude Code’s total is tool schemas for 27 tools, not the system prompt (Systima, 2026-07-12).
- Same model, same tasks, different harness: Databricks measured cost per task differing “more than 2x in some cases, while quality remained the same” (Databricks, 2026-07-08).
- The cheaper model cost more. Sonnet 5 is 1.67x cheaper per token than Opus 4.8 at standard rates and cost $2.09 per task against $1.94, at 81% success against 87% (same source).
- That 4.7x floor gap inverts once both harnesses are loaded. Claude Code’s practical configuration measured roughly 75,000 tokens; OpenCode’s measured 90,817 (same source). Your additions outgrow the vendor’s.
- Measured on my own session: cache reads were 64% of a $14.93 bill and model output was 18%, and 24 MCP tools cost 0 tokens once tool search is left at its default. Reading is the cost centre, not writing.
- Generic cost-per-task benchmarks are an open question, not a datapoint. The most rigorous harness study of the quarter published its cost axis as an unlabelled chart.
What do four independent measurements agree on?
| Measurement | Who | Date | Held constant | What moved | Headline result | Tier |
|---|---|---|---|---|---|---|
| Proxy log, two CLIs | Systima | 2026-07-12 | Task, model | Harness | 32,800 vs 6,900 tokens pre-prompt | 3 |
| Internal PR corpus | Databricks | 2026-07-08 | Model, tasks, codebase | Harness | Cost per task “>2x in some cases”, quality same | 1 |
| SQLite rewrite by agent swarm | Cursor | 2026-07-20 | Task | Model mix, orchestration | $10,565 vs $1,339 on the same build | 1 |
| Own harness evaluation | GitHub | 2026-06-25 | 500 SWE-bench tasks | Harness, model | Published, but with no numeric axes | 1 |
| Per-developer spend | Anthropic | living doc | n/a | n/a | ~$13 per developer per active day | 1 |
That changing the harness moves cost more than changing the model does. Four organisations made the harness the variable inside eight weeks, and the largest single effect any of them measured was a 7.9x swing from orchestration shape at a fixed task (Cursor, 2026-07-20). They share no methodology, no codebase, and no incentive structure. That convergence across incompatible methods is a stronger argument than any single number in the table, and as far as I can find, no published page cites more than one of these four.
How were these four measurements actually made?
Four methods, four different levels of trust. One proxy log by an outside party, three internal benchmarks by vendors measuring their own product on their own workload. Read the methods before you read the numbers.
Systima ran a logging proxy between harness and endpoint, capturing request payloads and the returned usage blocks. Claude Code 2.1.207 against OpenCode 1.17.18, on claude-sonnet-4-5 with claude-fable-5 as validation. Three task types, three runs each on Sonnet, plus a five-run quality benchmark. A reproduction repo followed on 2026-07-13 after methodology pressure. It counts what actually crossed the wire, with pinned versions. It’s also a vendor blog with a small n, and the author conceded that the pinned model was chosen for subscription economics rather than recency.
Databricks filtered tasks from thousands of daily merged pull requests on their own multi-million-line codebase. Selection criteria were recency, human authorship, an associated test suite, and self-contained scope. Roughly 60% of the mix was medium complexity. They graded by compiled test execution: “We did not use an LLM judge to evaluate correctness, since we’ve found that this rewards sounding right over being right” (Databricks, 2026-07-08). That’s the right call, for the reasons LLM-as-judge is flaky sets out. The weakness is one company’s codebase, and one harness under test is their own.
Cursor had an agent swarm reimplement SQLite in Rust from the 835-page manual alone. No source, no test suite, no internet, graded against a held-out sqllogictest suite. Identical task across model mixes is a clean design. But a greenfield rewrite is not your codebase, and the setup needs infrastructure only Cursor has.
GitHub ran the same experiment shape on its own product. The title says it: “Evaluating performance and efficiency of the GitHub Copilot agentic harness across models and tasks.” Four models, 500 human-validated SWE-bench Verified bug-fix tasks, 89 TerminalBench2 tasks, a minimum of five runs per configuration, a two-hour timeout, ±1σ variance (GitHub Blog, 2026-06-25). Its results are a separate problem, covered below.
Two Systima figures were challenged in the Hacker News thread, and neither is load-bearing here. The 54x cache-write disparity (53,839 cache-write tokens against OpenCode’s 1,003 on identical work) draws a real concurrency objection. Near-identical calls fired before the first cache write lands will miss, and deduplicating in-flight requests is the standard fix. The 121,000-to-513,000 subagent fan-out drew a narrower objection, and it’s a mechanism question rather than a rebuttal: does the parent consume the child’s transcript at all, or only its result? Nobody resolved it. Treat both as discourse, not evidence.
What does your harness send before it reads your prompt?
About 32,800 tokens on Claude Code, about 6,900 on OpenCode, a 4.7x gap on the first request (Systima, 2026-07-12). The interesting part is the split. The system prompt is the small half.
Claude Code token overhead, broken down
Claude Code’s system prompt is 27,344 characters across three blocks, roughly 6,500 tokens. OpenCode’s is 9,324 characters in one block, roughly 2,000. Tool schemas are the bulk: 27 tools and 99,778 characters for Claude Code, roughly 24,000 tokens, against 10 tools and 20,856 characters for OpenCode, roughly 4,800. So about 73% of Claude Code’s pre-prompt payload is tool descriptions.
That’s a schema-design outcome. It’s the same claim tool design is prompt design made from the authoring side, measured here from the billing side. And the honest reading isn’t that Claude Code is wasteful. Twenty-seven tools is a capability decision with a per-request price, and the price is now legible. Some readers want the 27 tools. That’s a trade, not a defect.
Before going further, here’s a second independent instance of that measurement, because every page covering this topic quotes Systima’s number and none publishes its own. Running /context on this repo today, on Claude Code with Opus 5, the vendor floor reports as 3.8k tokens of system prompt plus 12.9k of system tools, about 16,700 total. That is roughly half Systima’s 32,800, measured three weeks later on a different model and a newer build. Two takeaways. The direction of their finding holds, since a five-figure prefix arrives before you type. But the specific number is a snapshot of one version, and anyone quoting 32,800 as a current constant is quoting July.
One more line from the same screen matters more than the floor, and it’s covered below: 24 MCP tools, 0 tokens.
Then the gap inverts, and this is the part almost nobody quotes. Loaded up, Claude Code’s practical configuration (“four MCP servers plus installed plugins and the same instruction file”) produced a 311KB payload of roughly 75,000 tokens carrying 118 tools. OpenCode’s loaded configuration ran eleven MCP servers and the same 72KB instruction file. Its first request “metered 90,817 tokens on a cold cache write, carrying 179 tools and 277KB of schemas” (same source). The lean harness ended up more expensive in absolute terms.
Those two configurations aren’t matched, so this isn’t a controlled comparison. It’s something more useful. Claude Code grew 2.3x from its floor; OpenCode grew about 13x from its own. Whatever your harness ships with, the configuration you bolt on top is the term that scales.
That conflicting figure in the footnote matters. A dev.to teardown measured a constant ~14,328-token system prompt per call. GitHub issue anthropics/claude-code#52979 reported roughly 31k for the prompt “hi”, with a very high cache-read component the reporter flagged separately. Systima’s ~32,800 is system prompt plus tool schemas. These are probably measuring different quantities on different versions, and that’s worth saying rather than smoothing. Note also that issue #52979 was closed as not planned and carries a stale label. It’s evidence of practitioner pain, not a vendor admission.
Why do the parts you added compound faster than the vendor floor?
The vendor floor is fixed and you can’t edit it. Your additions are neither. A 72KB instruction file added just over 20,000 tokens per request to both harnesses. Five modest MCP servers added about 4,900 tokens on Claude Code, taking the tool count from 27 to 69 (Systima, 2026-07-12).
Anthropic’s own guidance lands on the same side. CLAUDE.md “is loaded into context at session start”, and if it contains detailed workflow instructions, “those tokens are present even when you’re doing unrelated work”. The recommendation is to “Aim to keep CLAUDE.md under 200 lines by including only essentials”, moving specialised instructions into skills that load on demand (Anthropic, Manage costs effectively). That’s the progressive disclosure argument restated as a cost argument, and it’s the other half of why a longer CLAUDE.md doesn’t reliably help.
I audited this repo against that guidance and the result surprised me twice. This project’s CLAUDE.md is 85 lines and 9,291 characters. My global instruction file adds 19 lines and 1,254 characters. Combined that’s 104 lines, comfortably inside the 200-line guidance.
The first surprise was the token count. Anthropic’s own rule of thumb is “1 token is approximately 4 characters”, which predicts about 2,640 tokens for those two files. Claude Code’s /context reports 4,255: 3.8k for the project file and 455 for the global one. The real ratio here is 2.48 characters per token, not four. Instruction files are dense with paths, backticked identifiers, and command names, and none of that tokenizes like prose. If you estimated your instruction-file cost from the 4-character rule, you are probably understating it by about 60%.
The second surprise was density. The Gotchas block alone is 14 lines and 4,991 characters, which is 54% of the project file’s bytes in 16% of its lines. That’s 357 characters per line. A 200-line file written at that density would run about 71,400 characters, and at the measured 2.48 ratio that’s roughly 28,800 tokens on every request of every session, comfortably larger than the vendor floor it sits on top of. The 200-line guidance is a proxy, and a file of long lines defeats it completely. Count tokens, not lines, and use /context rather than a character estimate.
There’s a correction owed on the MCP figure, and it comes from the vendor’s own docs. MCP tool search “keeps MCP context usage low by deferring tool definitions until Claude needs them. Only tool names and server instructions load at session start.” It is “enabled by default.” And critically: “It is also disabled when ANTHROPIC_BASE_URL points to a non-first-party host, since most proxies don’t forward tool_reference blocks” (Anthropic, Connect Claude Code to tools via MCP).
A logging proxy is exactly a non-first-party ANTHROPIC_BASE_URL. So Systima’s MCP increment was measured on the tool-search-disabled path, not the shipping default. Treat that +4,900 as an upper bound.
You can see the difference directly. On this repo, with tool search at its default, /context reports 24 MCP tools consuming 0 tokens, annotated “loaded on-demand”. Not a reduced number. Zero. The +4,900 is not what MCP servers cost you; it’s what they cost when a proxy turns deferral off. That’s the single largest correction available to the current coverage of this topic, and it’s measurable in one command. The 27-tool built-in figure is unaffected, because built-ins are never deferred. Anthropic also documents ENABLE_TOOL_SEARCH=auto, which loads schemas upfront only when they fit inside 10% of the context window.
The same screen names a segment the discussion has missed entirely. Skills registered 9.9k tokens across 74 skills, resident at session start, which on this machine is more than twice the instruction files and larger than any segment except the built-in tool schemas. Skills are the recommended destination for anything you cut from CLAUDE.md, so it’s worth knowing they are not free either. They are cheaper per unit of capability, not costless.
I noticed this because I’d hit the same env-var behaviour writing about running non-Anthropic models inside the Claude Code harness. It also rhymes with why MCP over stdio doesn’t scale. That post measured the resident-memory version of this tax; this is the token version. Both are fixed by loading less per client.
Do caching and tool deferral already solve this?
Partly, and between them they cover roughly 4,900 of the about 57,700 tokens in a loaded configuration (Systima, 2026-07-12; Anthropic, Manage costs effectively). Both rebuttals are real, both are absent from every competitor page I read, and neither survives intact.
Objection 1: prompt caching makes the prefix nearly free
Cache hits bill at 0.1x base input (Anthropic pricing), so a 33k prefix read from cache costs a tenth of a fresh read, and the break-even against re-doing dynamic discovery arrives fast. That’s correct as far as it goes.
Here’s the arithmetic it skips, with every assumption exposed. Take a 32,800-token vendor prefix, 200 requests in an active day, four cache-expiry events, and Sonnet 5 standard rates from 2026-09-01.
| Line item | Tokens | Rate | Cost per day |
|---|---|---|---|
| Prefix, cache reads (196 requests) | 6,428,800 | $0.30 / MTok (0.1x) | $1.93 |
| Prefix, cold cache writes (4 events) | 131,200 | $6.00 / MTok (2x, 1h TTL) | $0.79 |
| Prefix subtotal | $2.72 | ||
| Your typed prompts (200 × ~50 tokens) | 10,000 | $3.00 / MTok | $0.03 |
The prefix you didn’t author and can’t edit costs about 90x what you actually type, even at the cheapest rate the platform offers. It’s about 21% of Anthropic’s published $13 per developer per active day. A big prefix isn’t free under caching. It’s deferred, and every break longer than the cache lifetime pays for it again. Anthropic supplies the mechanism directly: the lifetime “is an hour on a subscription and drops to five minutes once you’re drawing on usage credits; on an API key or cloud provider, it’s five minutes by default”, and “your first message after a break longer than the cache lifetime misses the cache and reprocesses your full context” (Anthropic, Manage costs effectively).
Change any input you like. The ratio barely moves, because every Sonnet 5 rate scales together. This is the size of the prefix, which is the thing cache-aware prompting optimises the reuse of. A 90% hit rate on 33,000 tokens of vendor scaffolding is still 33,000 tokens of vendor scaffolding.
That table is a model. Here is a real bill. /usage for the session that produced this post reports $14.93 on Opus 5, against 19.1m cache-read tokens, 267.0k cache-write tokens, 108.6k output tokens, and 176 uncached input tokens. Priced at Opus 5 rates, that decomposes as:
| Line item | Tokens | Rate | Cost | Share |
|---|---|---|---|---|
| Cache reads | 19,100,000 | $0.50 / MTok (0.1x) | $9.55 | 64% |
| Cache writes | 267,000 | $10.00 / MTok (2x, 1h TTL) | $2.67 | 18% |
| Output | 108,600 | $25.00 / MTok | $2.72 | 18% |
| Uncached input | 176 | $5.00 / MTok | $0.0009 | ~0% |
Those four lines sum to $14.94 against a reported $14.93, and the 1-hour write rate is what makes them reconcile, which independently confirms the subscription cache lifetime. Read the shares rather than the total. Two thirds of the bill was re-reading context at the maximum available discount. Everything the model actually wrote was 18%. Reading is the cost centre, not writing, which is the same conclusion our output-compression experiment reached from the other end.
One honest qualification, because it bounds the claim. Those cache reads are not mostly vendor prefix. /context for the same session shows 256.5k tokens of conversation against a 16.7k floor, so history dominates the re-read volume. The prefix is the larger share of a short session and a minority of a long one. What survives in both cases is the shape: the send side is where the money goes, and a discount on a large number is still a large number. Concede the honest half too. At a high sustained hit rate on a genuinely stable prefix, this objection substantially wins.
Objection 2: tool deferral already fixed this
It shipped, and Anthropic’s cost page says plainly that “MCP tool definitions are deferred by default, so only tool names enter context until Claude uses a specific tool” (Anthropic, Manage costs effectively). Three-part answer. It covers MCP tools only, not the 27 built-ins that are roughly 24,000 of the measured 32,800. It’s disabled behind a proxy, which is the measurement case above. And it does nothing about instruction files, which are the other 20,000. The vendor shipped a real mitigation for one of four segments. Roughly 4,900 tokens of about 57,700 in a loaded configuration is useful, not decisive.
One more critique deserves air, and it’s the sharpest structural one in the thread: even with tools disabled, Claude Code carries commands and affordances the model is specifically optimised for, so a harness comparison is confounded by model-harness co-training. That’s right, and it doesn’t have a clean fix. It’s also the strongest argument for the recommendation at the end of this post, which is to measure your own configuration rather than trust anyone’s cross-harness ratio. Systima’s own concession makes the point better than a critic could: “This is like saying contractor (A) asked for $33,000 to undertake the work and contractor (B) asked for $7,000. Are we measuring and caring about the right thing?”
What happens when you hold the model constant and change the harness?
Databricks did exactly that experiment on their own codebase, and reported it in one sentence: “When we ran the same model with the same thinking effort through two different harnesses (Claude Code/Codex vs Pi), we observed that the cost per task differed significantly (more than 2x in some cases), while quality remained the same” (Databricks, 2026-07-08). Same model, same thinking effort, same tasks. Only the harness moved.
The mechanism they name is context hygiene. Their Pi harness sent about 3x less context per turn, with better context management producing fewer model invocations per task. Fewer turns, each carrying less. That compounds in both terms at once.
A caveat on precision, because it cuts against the number I’d have liked to print. Several widely-circulated summaries of this benchmark carry a specific 2.08x figure and a paired 85%-against-87% success comparison. I couldn’t find either in the primary text. What Databricks states numerically is “>2x in some cases” with quality held equal. If a specific harness-swap multiple is quoted at you, ask which sentence it came from.
One design detail from the same post says something broader. Databricks “sealed git history: for the length of each run, we cut the working copy off from the repository entirely”, because agents were recovering the correct implementation from history rather than deriving it. A harness’s information diet is a correctness variable, not only a cost variable. That’s the same finding agent memory architecture reaches from the memory side. Their own summary line: model choice is only one piece of the puzzle.
Why did the cheaper model cost more per task?
Sonnet 5 costs $3 per million input tokens against Opus 4.8’s $5, and $15 output against $25 (Anthropic pricing). Because both price output at exactly 5x input, the ratio holds for any input-output mix and every cache category: Sonnet 5 is 0.60x the price, or 1.67x cheaper per token. On Databricks’ tasks it cost $2.09 per task against Opus 4.8’s $1.94, at 81% success against 87%.
Work backwards and you get the token burn. Paying 1.08x more per task at 0.60x the rate implies about 1.8x more tokens consumed. That derivation assumes Databricks priced at standard rates. If they used the introductory Sonnet 5 rates in force when they published, the ratio is 0.40 and the implied burn is about 2.7x. They don’t state which, so the honest range is 1.8x to 2.7x. Either way, a lower sticker price bought a higher bill.
Now the counter-case, because it runs both directions. GLM 5.2 came in at $1.28 per task, statistically tied with Opus 4.8 on quality. Cheap models do sometimes just win. The point isn’t that cheap models are a trap. It’s that per-token price doesn’t predict per-task cost in either direction, which is the price-side companion to what open-weight versus frontier argued from the capability side. Databricks put it in one line: “The token price of a model is a poor indicator of actual costs incurred on end-to-end tasks.”
The tokenizer arrived with Opus 4.7, not Sonnet 5
Then there’s the tokenizer, which is the version of this that bites in September. Get the provenance right: it arrived with Claude Opus 4.7, not with Sonnet 5. Anthropic states it as a family property: “Claude 4.7 and later models and Claude Mythos Preview use a newer tokenizer… This tokenizer produces approximately 30% more tokens for the same text… Claude Sonnet 4.6 and earlier models use the previous tokenizer” (Anthropic pricing). The migration guide frames the same change as a range, roughly 1x to 1.35x. Sonnet 5 inherits it, which is precisely why the Sonnet 4.6 to Sonnet 5 hop is where Sonnet users first meet it. Anthropic says the consequence outright: “the cost of an equivalent request can differ from Claude Sonnet 4.6 even though per-token pricing is unchanged” (Anthropic, What’s new in Claude Sonnet 5).
Two dates and two defaults you did not choose
Two dates and two defaults, all of which are harness-level costs you didn’t choose. Introductory Sonnet 5 pricing of $2 input and $10 output per million runs through August 31, 2026, with cache rates of $2.50, $4, and $0.20. From September 1 it’s $3, $3.75, $6, $0.30, and $15, with batch mirroring at $1/$5 then $1.50/$7.50. So a workload that reads cost-neutral in August is not cost-neutral in September, twice over: the rate rises 50% and the same text bills roughly 30% more tokens. Meanwhile adaptive thinking is on by default on Sonnet 5, thinking bills as output, and the 1M context window “is both the default and the maximum; there is no smaller context variant”. Anthropic’s cost page notes the thinking budget “can be tens of thousands of tokens per request depending on the model”. All of which is an argument for pinning model versions and running an upgrade eval before the rate card moves under you, which is its own subject.
Why doesn’t the 7.9x orchestration result transfer?
Cursor ran the same SQLite build through several model mixes. GPT-5.5 doing the whole job alone cost $10,565. Opus 4.8 planning with Composer 2.5 working cost $1,339, a 7.9x gap. The worker fleet alone went from $9,373 to $411, a 22.8x difference on the same task (Cursor, 2026-07-20). And you almost certainly can’t reproduce it.
The reason is infrastructure. “The browser swarm from earlier this year peaked at roughly 1,000 commits per hour on Git. The new system peaks at around 1,000 commits per second.” That’s roughly 3,600x, and standard version control does not survive it. So Cursor built a new VCS plus merge arbitration: “We created a system where a neutral third-party agent intervenes on merge conflicts and resolves them on behalf of all parties.” The conflict numbers show why. The old run hit more than 70,000 conflicts before they paused it. The new run logged fewer than a thousand across four hours. The 7.9x is a joint result of the planner-worker split and infrastructure that isn’t on the market.
Two things here do transfer. The first is a second inversion, corroborating the previous section from a different direction. Cursor describes their Fable 5 planner variant as more expensive than the Opus 4.8 hybrid, despite the cheaper planner. Two vendors, two workloads, same finding. A cheaper model in the expensive seat can raise the total.
The second is the token-to-cost decoupling. Workers carried “at least 69% of the tokens, and over 90% in most” configurations. Yet in the Opus mix, “the Opus-as-planner produced a small fraction of the tokens but roughly two-thirds of the cost”. Where the tokens are is not where the money is. That generalises to any tiered pipeline, and it’s the mechanism underneath the router pattern and spawn-versus-stay subagent design. The quality result matters too, so the cost figure isn’t read alone: every new configuration reached 73% to 85% within four hours and eventually passed 100% of the held-out suite.
What does an agent task cost? Nobody can tell you
There’s no trustworthy general figure. Nearly every number in circulation traces to aggregators reselling each other’s estimates, and the one credible study in this window published its results as unlabelled charts. Treat cost per task as an open question.
GitHub’s harness evaluation is the whole argument in one artifact. It states its method numerically: four models, 500 SWE-bench Verified tasks, 89 TerminalBench2 tasks, a minimum of five runs per configuration, a two-hour timeout, ±1σ run-to-run spread. Then it presents every result graphically with no numeric axis labels. Three figures carry the findings, including a resolution-rate-versus-cost-per-task scatter captioned “Up and to the left is better: solve more, spend less” (GitHub Blog, 2026-06-25). The prose carries conclusions qualitatively, with the only numeric result being relative: for GPT 5.4 and 5.5, “CLI performed better in all cases except SWE-bench Verified, where it did 7% and 4% worse, respectively.” The most rigorous harness-cost study of the quarter is the one whose cost axis you cannot read. Any specific Copilot cost-per-task figure attributed to it was pixel-read, not published.
A rigorous alternative exists, and its value is the shape rather than the number. METR’s Expenditure Horizon reframes agent capability as a dollar crossover: “the dollar value at which the improvement to the goal metric is equal to the improvement by a human with the same budget.” On the NanoGPT speedrun, the human baseline is roughly $2,500 per 1% improvement, about 16 hours of work. After more than $10K of expenditure they report horizons of $0 to $3K, with Opus 4.8 at $3,300 and GPT-5.5 at $2,300 (METR, 2026-07-21). To say anything defensible about agent cost, you have to fix a workload, fix a scorer, and publish the baseline. METR supplies its own deflator too. The speedrun’s maintainer judged the mergeable share of actual speedup at roughly 60% for Opus 4.8 and 50% for GPT-5.5, because many contributions were brittle hyperparameter tuning. A dollar horizon is not a productivity claim.
What is published and tier 1 is spend per developer, not per task: “the average cost is around $13 per developer per active day and $150-250 per developer per month, with costs remaining below $30 per active day for 90% of users” (Anthropic, Manage costs effectively). Same page: agent teams “use approximately 7x more tokens than standard sessions when teammates run in plan mode”, and background token use is “typically under $0.04 per session”. Those are the numbers to budget against.
Why does the per-task number resist publication? Task difficulty isn’t comparable across codebases. Harness configuration goes unstated in almost every claim. And the tokenizer under the number changes between model versions. Databricks and Cursor could publish per-task dollars precisely because each fixed a workload and said so. If you searched this topic before landing here, you’ve probably read three pages quoting a confident dollar figure for a generic agent task. I read them for gap analysis and cited none, because not one traces to a primary source that measured it.
Rank your levers before you change your model
Four levers, ranked by measured effect on the same work. Orchestration shape: up to 7.9x, measured but not reproducible without custom infrastructure (Cursor, 2026-07-20). Harness and context shape: more than 2x at equal quality, on a real codebase (Databricks, 2026-07-08). Instruction-file and MCP hygiene: roughly 25,000 tokens per request (Systima, 2026-07-12). Per-token price: 1.67x nominal, and it inverted to a 1.08x increase on real tasks. The fourth one is where almost every competing article starts.
The same ranking holds for elapsed time, and a later week of first-hand session measurement put numbers on it. Model latency was 19% of the clock while tool execution was 58%, most of that a single tool blocking on a human. If the question is wall-clock rather than spend, the levers are how many questions get asked and how many subagents get dispatched, and model choice still ranks last.
State the boundary conditions, because this thesis has two. If your harness overhead is already small and your workload is a high volume of short, similar turns, per-token price is your dominant term and routing wins.
The second one is sharper and I only found it by measuring my own session. The fixed prefix dominates while the conversation is short, and conversation history overtakes it as the session runs. On the session that produced this post, the vendor floor was 16.7k against 256.5k of accumulated messages. So harness hygiene is the high-leverage lever at the start of a session and on short tasks, while /clear discipline and context management take over on long ones. Both are send-side levers, which is the point. Neither is your model.
This sequence also assumes you can see your spend broken down. Team-level cost observability covers the per-repo, per-team, per-feature attribution layer; tracking Claude Code usage is the personal version. And it’s the other end of the bill from our attempt to cut Claude’s output: that post found a 20-30% ceiling on the tokens the model writes, while this one measures the floor on the tokens the harness sends. The send side is the larger number in every measurement here.
Do this before you open a pricing page
- Run
/context. Note the split across system prompt, tool schemas, instruction files, and MCP tools. This is the reproduction step for the whole post. - Run
/usage. It attributes recent usage to skills, subagents, plugins, and individual MCP servers, and flags long context or cache misses when one accounts for 10% or more. - Cut instruction files toward 200 lines, and check characters too. Move specialised workflows into skills.
- Run
/mcpand disable unused servers. Prefergh,aws, andgcloudwhere a CLI exists, since they add no per-tool listing. - Set the thinking effort level deliberately instead of accepting the default.
/clearbetween unrelated tasks. Only then compare models, and compare on cost per completed task rather than cost per token.
Every item is drawn from Anthropic’s own guidance on reducing token usage.
FAQ
Why does Claude Code use so many tokens before I type anything?
Tool schemas dominate the prefix. Roughly 24,000 of about 32,800 pre-prompt tokens are descriptions for 27 built-in tools, while the system prompt is about 6,500 (Systima, 2026-07-12). Run /context to see your own split, including instruction files and MCP servers.
Will switching to a cheaper model reduce my agent bill?
Not reliably. On Databricks’ own tasks, Sonnet 5 is 1.67x cheaper per token than Opus 4.8 at standard rates and cost more per task, $2.09 against $1.94, because it consumed substantially more tokens getting there (Databricks, 2026-07-08). Compare cost per completed task on your own workload.
How much does CLAUDE.md cost me per request?
It loads at session start and stays in context for every request in the session, including unrelated work. A 72KB instruction file measured at just over 20,000 tokens per request (Systima, 2026-07-12). Anthropic recommends keeping it under 200 lines and moving specialised instructions into skills, though characters are the better unit: 200 dense lines can carry 17,000 tokens.
What does an agent task actually cost in dollars?
There’s no trustworthy general answer. Published per-task figures come from organisations measuring their own workloads ($1.28 to $2.09 at Databricks, $1,339 to $10,565 for one large greenfield build at Cursor) and don’t transfer. The tier-1 figures to budget against are per developer: about $13 per active day and $150-250 per month (Anthropic).
Conclusion
The pre-prompt floor is about 33,000 tokens and roughly 73% of it is tool schemas. Four organisations made the harness the variable inside eight weeks and all four found the same direction. Holding the model constant and changing the harness is worth more than 2x at equal quality. Your instruction file and MCP servers are the part that compounds, and loaded up they can outgrow the vendor floor entirely. The cheaper model can cost more per task, and did. The 7.9x orchestration result needs infrastructure you don’t have. Cost per task has no general primary source, so use your own.
Run /context and /usage before you open a pricing page. If tool schemas and instruction files are most of your prefix, changing models is the fourth-best thing you could do this week.
The four earlier cost posts on this site were all correct and all second-order. This is the first-order one.
One postscript on the tokenizer. It is the change that moved the bill without a code change, and it arrives on a vendor schedule rather than yours.
Sources
- Systima, Claude Code Sends 4.7x More Tokens Than OpenCode Before Reading Your Prompt, 2026-07-12, updated 2026-07-13, retrieved 2026-08-02.
- Databricks, Benchmarking Coding Agents on Databricks’ Multi-Million Line Codebase, 2026-07-08, retrieved 2026-08-02.
- Cursor, Agent swarms and the new model economics, 2026-07-20, retrieved 2026-08-02.
- Shibani Basava and Carlos Castro, GitHub, Evaluating performance and efficiency of the GitHub Copilot agentic harness across models and tasks, 2026-06-25, retrieved 2026-08-02.
- METR, Expenditure Horizon: Measuring Optimization Ability, with an Application to NanoGPT, 2026-07-21, retrieved 2026-08-02.
- Anthropic, Manage costs effectively (Claude Code docs, living document), retrieved 2026-08-02.
- Anthropic, Pricing (living document), retrieved 2026-08-02.
- Anthropic, Model migration guide (living document), retrieved 2026-08-02.
- Anthropic, What’s new in Claude Sonnet 5 (living document), retrieved 2026-08-02.
- Anthropic, Connect Claude Code to tools via MCP (living document), retrieved 2026-08-02.
- Hacker News, thread 48883275 (705 points, 396 comments), 2026-07-12, retrieved 2026-08-02.
- anthropics/claude-code, Issue #52979 (closed as not planned, labelled
staleandarea:cost), retrieved 2026-08-02. - Birgitta Böckeler, martinfowler.com, Harness engineering for coding agent users, 2026-04-02, retrieved 2026-08-02. Note: uses “harness” in a different sense, meaning quality-regulation scaffolding rather than token economics.
Original data note: all first-party measurements are of this repository and this author’s Claude Code session on 2026-08-02, running Opus 5. Character counts are wc output: the project CLAUDE.md is 85 lines and 9,291 characters, the global instruction file adds 19 lines and 1,254 characters, and the Gotchas block alone is 14 lines and 4,991 characters. Token counts (3.8k project, 455 global, 12.9k system tools, 3.8k system prompt, 9.9k skills, 0 for 24 MCP tools) are Claude Code’s own /context report, which the docs describe as approximate and computed from local session history. The 2.48 characters-per-token ratio is derived from those two figures. The session cost decomposition is /usage output (19.1m cache read, 267.0k cache write, 108.6k output, 176 input, $14.93 reported) priced at published Opus 5 rates; the derived line items sum to $14.94, and the 1-hour cache-write rate is the one that reconciles. This is one developer, one machine, one session, on a subscription plan. It is a second instance of a measurement, not a study. The earlier per-day table remains a model over stated assumptions, not a bill.
Verification note: every figure was re-verified against its primary on 2026-08-02. Three corrections resulted. Widely-circulated summaries of the Databricks benchmark carry a 2.08x harness multiple with paired 85%-against-87% success rates; neither appears in the primary text, so this post uses the “>2x in some cases” language Databricks actually published. The GitHub harness evaluation is frequently described as covering “20+ frontier models”; the article states four. A claim that Anthropic’s published per-developer figure doubled from $6 to $13 per active day could not be confirmed against an archived snapshot, so it was cut rather than hedged. A reported DeepSeek peak-hour pricing surcharge was also cut: DeepSeek’s own pricing documentation shows flat per-token rates, and the claim traces to a cluster of aggregators with no primary link.
If it was useful, pass it along.